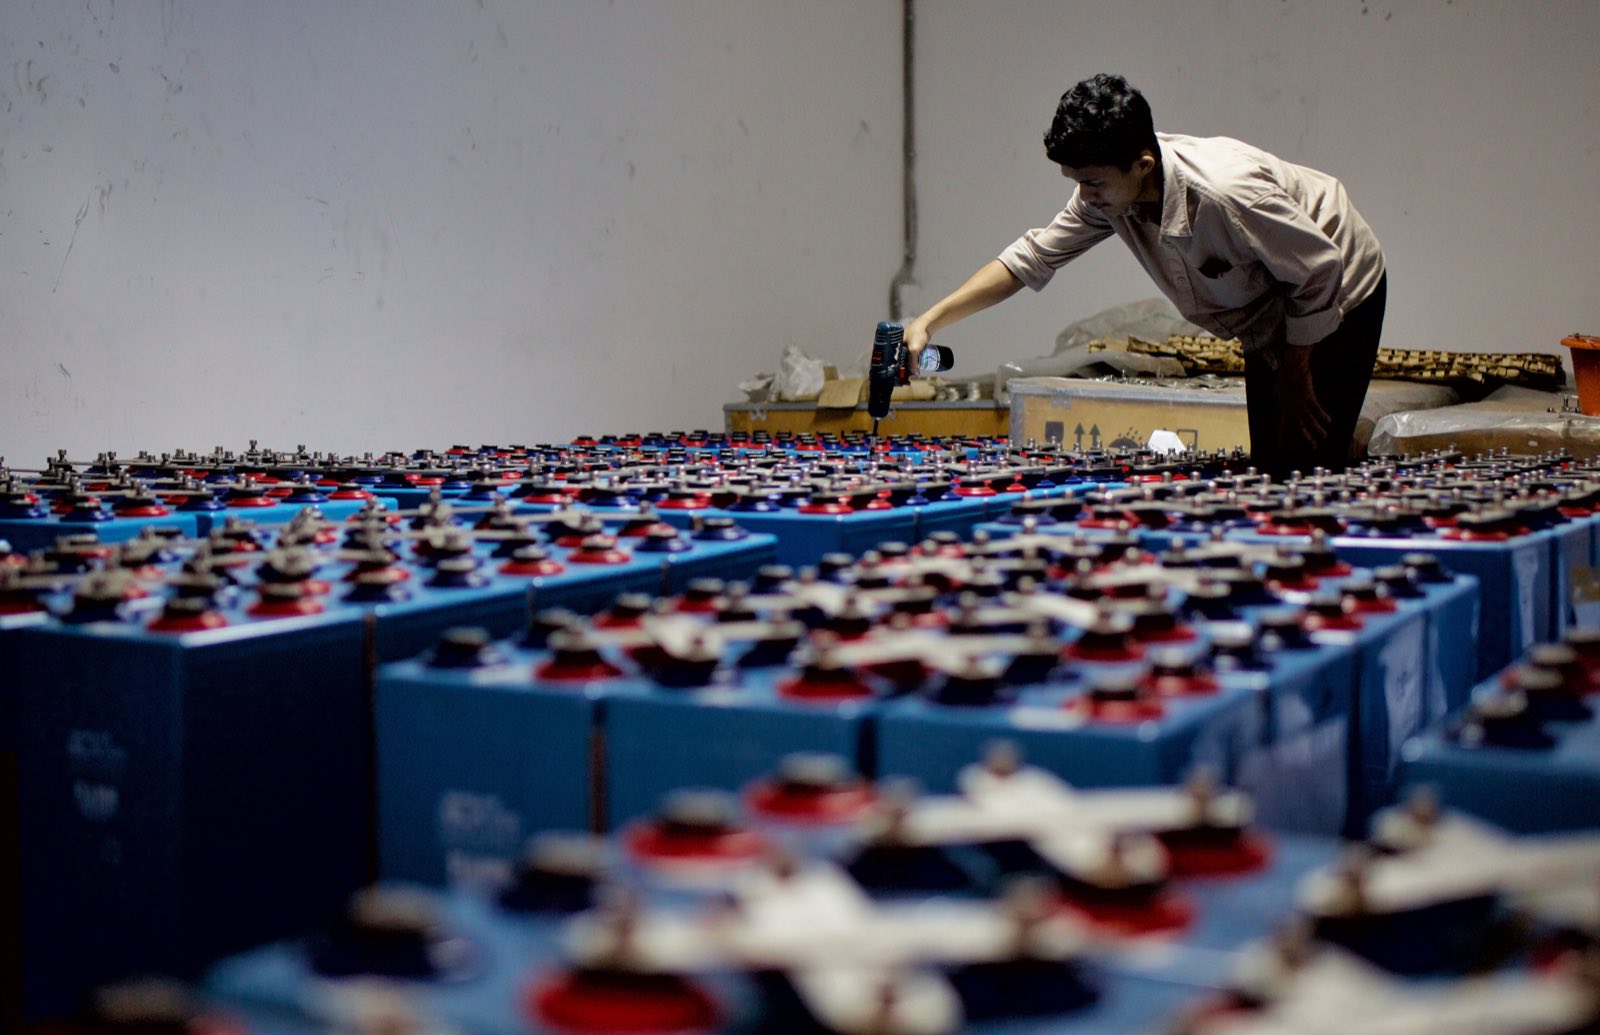
Today we hear about tonnes of revolutionary energy storage technologies that are supposed to be the cheapest and safest. However, what most articles don’t highlight is the commercial maturity of these technologies. In this piece, we are going to go three layers deep. First, where each battery technology actually sits on the road from pilot to full commercialization based on its cost and energy density. Second, we will look into how LFP cells, which dominate stationary storage, actually work in plain terms and pictures. Third, the ways an LFP cell fails, and how the battery and thermal management systems (BMS and BTMS) have to be designed to catch each one.
LFP batteries are at the forefront of energy storage applications and are on their way to becoming the workhorse of stationary storage in the short term. LFP battery storage currently makes up most stationary storage, and CATL is the largest supplier, supplying around 40% of the cells globally. It is important to understand how the cell works and how to design the battery around it.
I spent seven years at Tesla across the arc from cell to fleet, and the thread running through all of it is that the interesting decisions are not about which chemistry wins on paper. They are about what you can buy, how it ages, and what happens when something goes wrong.
Note on the numbers and images. Every figure is sourced, and the sources are listed at the end. Where I could not find a credible published figure, it says so. Ranges differ between sources because cell format, test conditions, and vintage all differ, so I have given a band. Manufacturer targets are labelled as targets, not measured results. Images are generated using AI for clear illustration and are by no means close to research-level accuracy.
Section 1: Battery storage technologies at different states of commercialization
Commercial maturity of an energy storage technology depends on the cost and energy density. Here is where each battery technology stands.
Fully commercial and dominant. LFP and the nickel chemistries (NMC and NCA) are mature, deeply supplied, and account for the overwhelming majority of the cells we see in EVs and stationary storage. For stationary storage, LFP has effectively won the sub-four-hour grid market on cost and safety.
Commercial and scaling. Sodium-ion crossed from lab to line this year. CATL confirmed large-scale mass production for 2026, and grid products and the first mass-produced sodium-ion passenger vehicle are arriving (evlithium; Energy Solutions). Vanadium flow is commercially deployed and scaling for long-duration jobs. Both are mature, but neither has LFP’s supplier depth yet.
Early commercial. Iron-air plays in a different field — multi-day storage. It is commissioning its first commercial-scale systems now. Zinc-based long-duration batteries are scaling into grid projects. Iron flow is deployed but limited; its leading US developer stated in a June 2026 SEC filing that significant yield, cost, performance, and manufacturing challenges remain (ESS Tech 8-K).
Pilot only. Solid-state is the one everyone waits for and no one can buy at scale. First small-batch cells are expected around 2027, with mass production converging on 2030 (IDTechEx; evlithium). Every full solid-state performance figure today is a target.
Techno-economic comparison
| Technology | Commercial Leaders & Pilots | Maturity | Energy Density (Wh/kg) | Cycle Life | Operating Temperature | Cost | Best-Fit Job |
|---|---|---|---|---|---|---|---|
| LFP | CATL (~40% global share), BYD (~14%), EVE Energy, Gotion, CALB; fifth-gen LFP in mass production (TYCORUN; evlithium) | Commercial, dominant | 90–160 | 3,000–10,000 | Charge 0 to 50°C, discharge -20 to 60°C (EVE Energy) | ~$70–100/kWh (BNEF 2025) | Home and grid storage under 4h |
| NMC | CATL, LG Energy Solution, Samsung SDI, SK On, Panasonic | Commercial | 150–250; 811 up to ~300 | 1,500–3,000 | Charge from 0°C; discharge to about -20°C (Everplus) | Pack ~$128/kWh; NMC 811 cell ~$64–65/kWh (BNEF 2025) | Long-range and premium EVs |
| NCA | Panasonic (Tesla cells), LG Energy Solution, Samsung SDI | Commercial | 200–260 | 500–1,500 | No verified figure found (broadly similar to NMC) | Above LFP; no clean standalone pack figure (highest cobalt content) | Premium long-range EVs |
| LTO | Toshiba (SCiB), Leclanché, Microvast | Commercial, niche | 60–120 | 10,000+ | No verified figure found | $150–200/kWh | Fast charge, frequency response |
| Sodium-ion | CATL (mass production 2026), BYD, HiNa, Faradion (owned by Reliance, expanding to 5 GWh in India), Natron, Northvolt, Altris (Energy Solutions; SodiumBatteryHub) | Commercial, scaling | 120–160 | Manufacturer claims only | Charge as low as -40°C; ~90% capacity at -20°C (Zvepow) | ~$50–120/kWh (near LFP parity, not yet below) | Stationary storage, cold climates |
| Vanadium flow | Invinity Energy Systems, Rongke Power, CellCube, Sumitomo Electric (Blackridge Research) | Commercial, scaling | Not weight-optimised | 20,000+, 20–30 yr life | ~10 to 40°C recommended for efficiency; operable -20 to 50°C (pv magazine / ScienceDirect) | ~$450–750/kWh capex; ~$800–1,200/kWh installed at sub-utility scale | Long-duration grid, 4–24h |
| Iron flow | ESS Inc | Early commercial | Not weight-optimised | 20,000+ reported | No verified figure found | No clean verified per-kWh figure; dominant maker ESS Tech flagged going-concern doubt in Q1 2026 | Long-duration grid |
| Iron-air | Form Energy | Early commercial | 50–80 | Multi-day cycling | No verified figure found | <$20/kWh system target (Form Energy claim, not independently verified) | Multi-day, seasonal grid |
| Zinc (aqueous) | Eos Energy Enterprises, e-Zinc (Exoswan) | Scaling | No verified figure found | No verified figure found | No verified figure found | ~$60/kWh cited for zinc-air (projection, not a verified market price) | Long-duration grid, 3–12h |
| Solid-state | Pilot lines only: Toyota, Samsung SDI, QuantumScape, CATL, BYD (batch demo ~2027), Factorial, Solid Power (evlithium) | Pilot only | 400–500 target; semi-solid 300–350 | No verified figure at scale | No verified figure found | No verified figure (pre-commercial) | Premium EVs, electronics (future) |
Ranges vary by source, format, and conditions. Energy density is the wrong yardstick for flow, iron-air, and zinc, which compete on duration and cost, not weight. Sodium-ion cycle-life numbers currently come from manufacturers, not independent testing: CATL states more than 10,000 cycles at 45°C for a grid product (Electrek), and Hithium reports 94.2% retention after 4,000 cycles with more than 20,000 projected at 70% state of health (LiFePO4-battery.com).
On the “Commercial leaders and pilots” column: these are the companies shipping or piloting each chemistry at scale as of mid-2026, not an exhaustive list. Market-share figures are for the overall EV battery market, where CATL and BYD together hold more than half (TYCORUN). For an Indian reader, note that Reliance owns Faradion and is building sodium-ion capacity domestically (Energy Solutions).
The takeaway for Indian businesses is simple. LFP is the default you can trust today, and sodium-ion is the one to track. The long-duration chemistries are still in their early phases and will matter more as renewable penetration deepens. Everything else is either a vehicle chemistry or a future you should plan for but not actively pursue.
Section 2: How an LFP cell actually works
Strip away the packaging and a cell is four things: a cathode, an anode, a separator, and an electrolyte that lets ions through but not electrons. In an LFP cell the cathode is lithium iron phosphate (LiFePO₄) coated on aluminium foil, and the anode is graphite coated on copper foil. Energy is stored by moving lithium ions back and forth between the two. The different states of the cell are illustrated below through AI-generated images.
Resting State
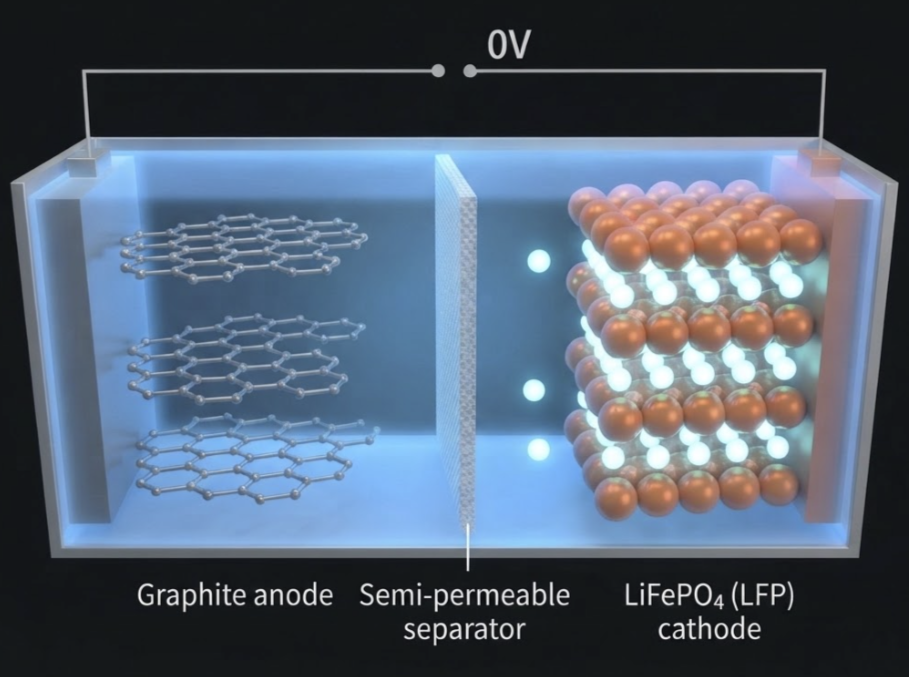
The above picture shows the cell in an equilibrium state. The individual components in the cell are as follows:
- The Cathode (Right, Green/Brown): This is the LiFePO4 (LFP) material. In its discharged state, its crystal structure is completely full of lithium ions (the bright spheres).
- The Anode (Left, Blue/Grey): This is layered graphite. It is currently empty of lithium.
- The Separator (Center): A membrane that allows ions to pass but blocks electrons.
Charging State
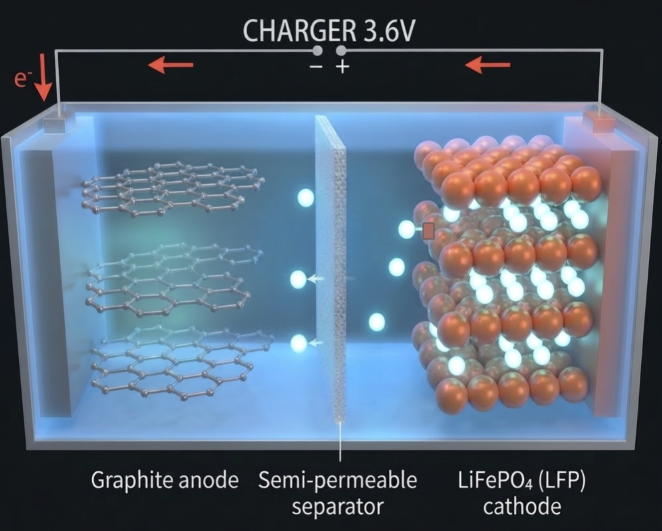
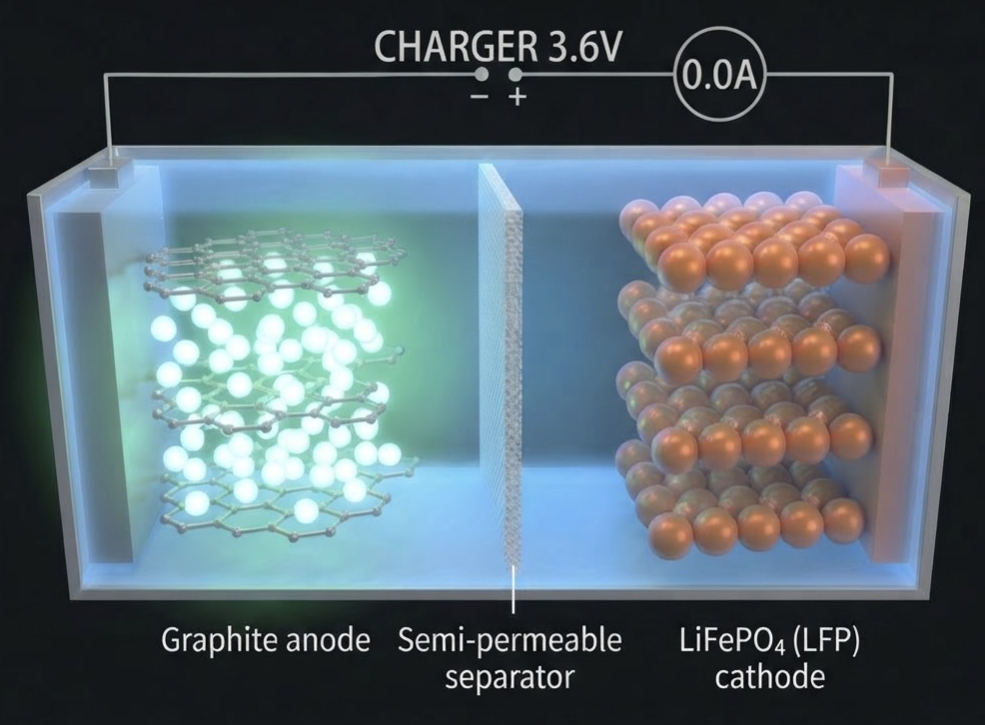
When you charge with an external charger it acts as an electron pump. It pulls electrons out of the cathode and pushes them to the anode. Losing electrons destabilizes the cathode, resulting in lithium ions breaking out of the LiFePO₄ crystal. This process is called de-intercalation. The lithium ions travel through the electrolyte and separator to the anode, where they settle in between the graphite layers. Ions move through the inside, electrons move through the outside, and they meet at the anode. The energy is now stored. The image on the right shows the fully charged state of the cell.
Discharging State
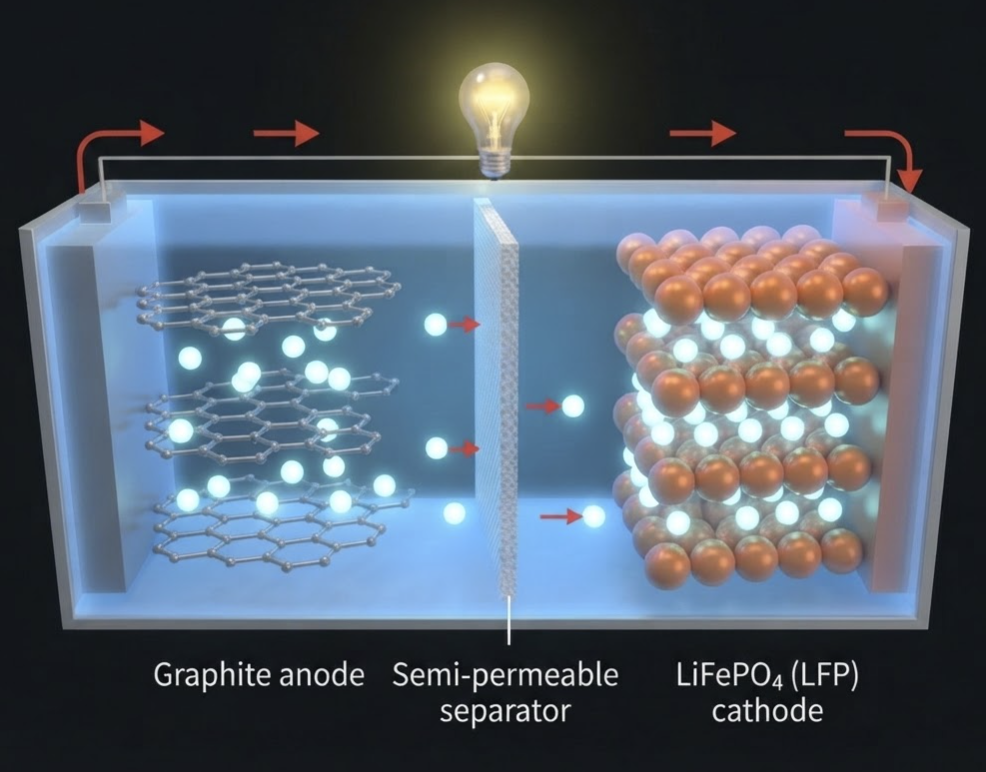
Discharge is the same process in reverse, and this time the electrons flow from the anode to the cathode, powering the load. Inside the cell the lithium ions leave the graphite and travel back to the cathode. When the ions are home in the LiFePO₄ again, the cell is discharged.
Section 3: LFP issues and how to design against it
A cell has a handful of failure modes. Each one has a temperature or a voltage where it starts, and each one has a specific job for the battery management system (BMS) or the thermal management system to catch it. This is where chemistry becomes engineering.
SEI layer growth
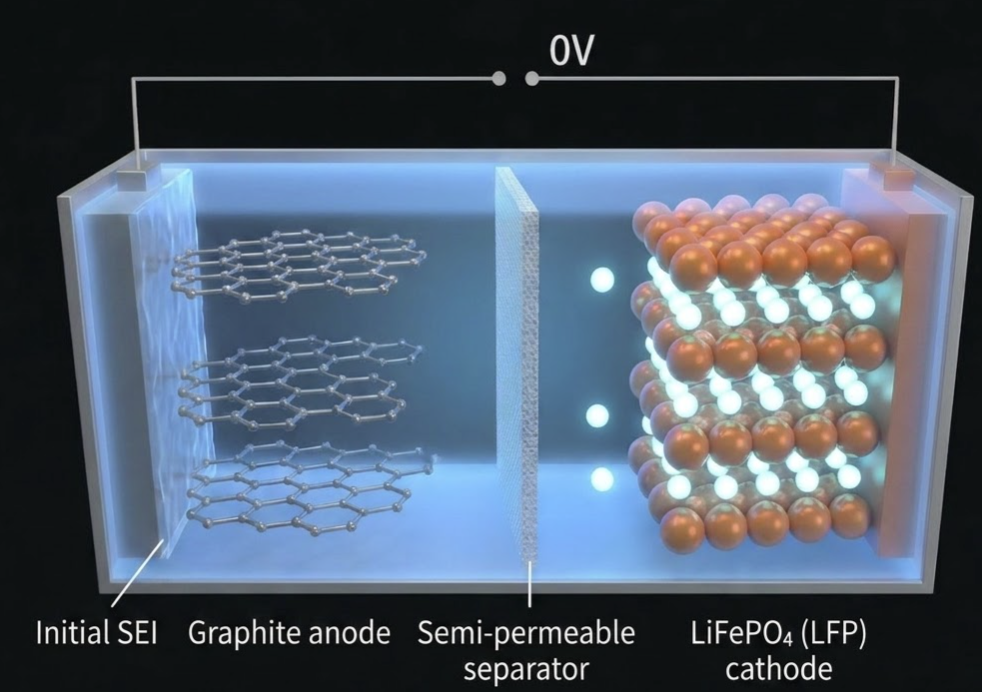
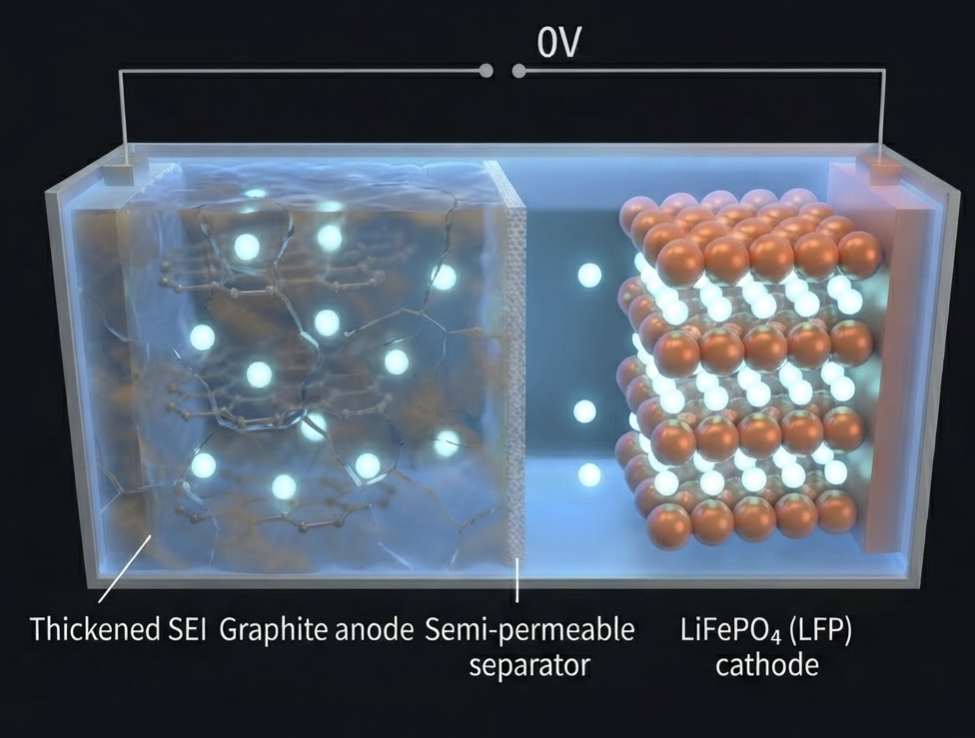
On the first charge, a thin protective film called the solid electrolyte interphase forms on the anode. It is necessary, as it seals the graphite surface, which prevents further electrolyte breakdown. However, it keeps growing slowly over the cell’s life, consuming lithium and raising the internal resistance of the cell. This is normal and results in gradual capacity fade rather than a safety event. This growth is also accelerated by heat, so it is necessary to operate the cell within a temperature range, which is -20°C to 45°C for LFP cells. The image on the right shows the growth of the SEI layer, which results in capacity loss.
Lithium plating and dendrites
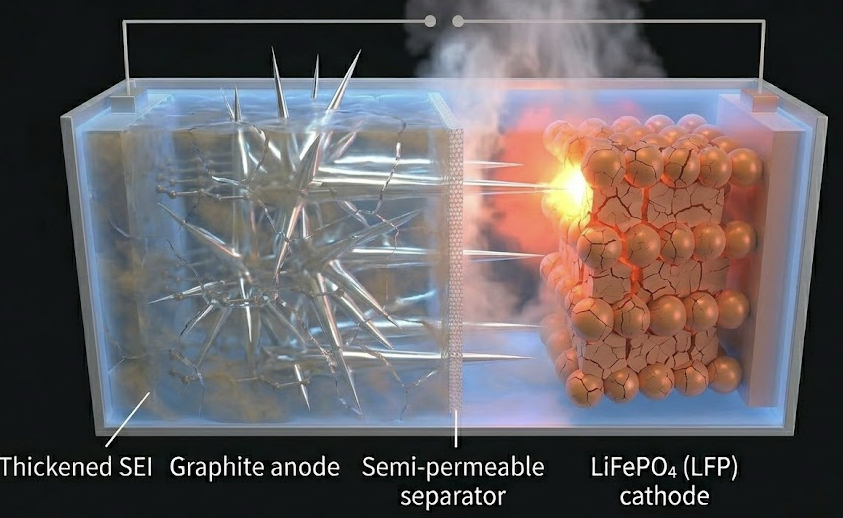
If a cell is charged too fast, or charged in too cold a temperature, or above its voltage limit, lithium cannot insert into the graphite quickly enough and instead deposits as metallic lithium on the anode surface. Over multiple cycles this builds needle-like dendrites that can pierce the separator and short the cell internally, which is a documented pathway to thermal runaway.
Copper dissolution from deep discharge
This failure mode is counterintuitive and dangerous. When a cell is drained too far, the anode’s potential rises until the copper current collector begins to oxidise and dissolve into the electrolyte. Reported onset varies by source and chemistry, from below about 2.3V (Eneronix), to as low as 0.5V in one synchrotron study of an NCA cell (Adv. Materials Technologies). LFP’s normal discharge cutoff is 2.5V (NEWARE). If you then try to recharge that damaged cell, the dissolved copper plates reform as sharp dendrites. Copper is the more dangerous dendrite: a soft lithium filament can sometimes fuse and clear itself, but copper melts at 1085°C and forms a permanent, highly conductive internal short (Nano Research). This is exactly why a good BMS permanently locks out a cell that has been driven too low (USPTO 10,193,354; Eneronix). It is absolutely necessary to design for this failure to prevent thermal runaway from a cell short.
Electrolyte decomposition and mechanical cracking. The liquid electrolyte breaks down slowly at the electrodes and faster at high voltage and temperature, generating gas, swelling the cell, and raising resistance. Meanwhile, the repeated expansion and contraction of the electrodes on every cycle causes micro-cracks that slowly isolate active material. Both show up as capacity and power fade over years.
Thermal runaway. This is the end state, and it follows a temperature ladder confirmed across the literature.
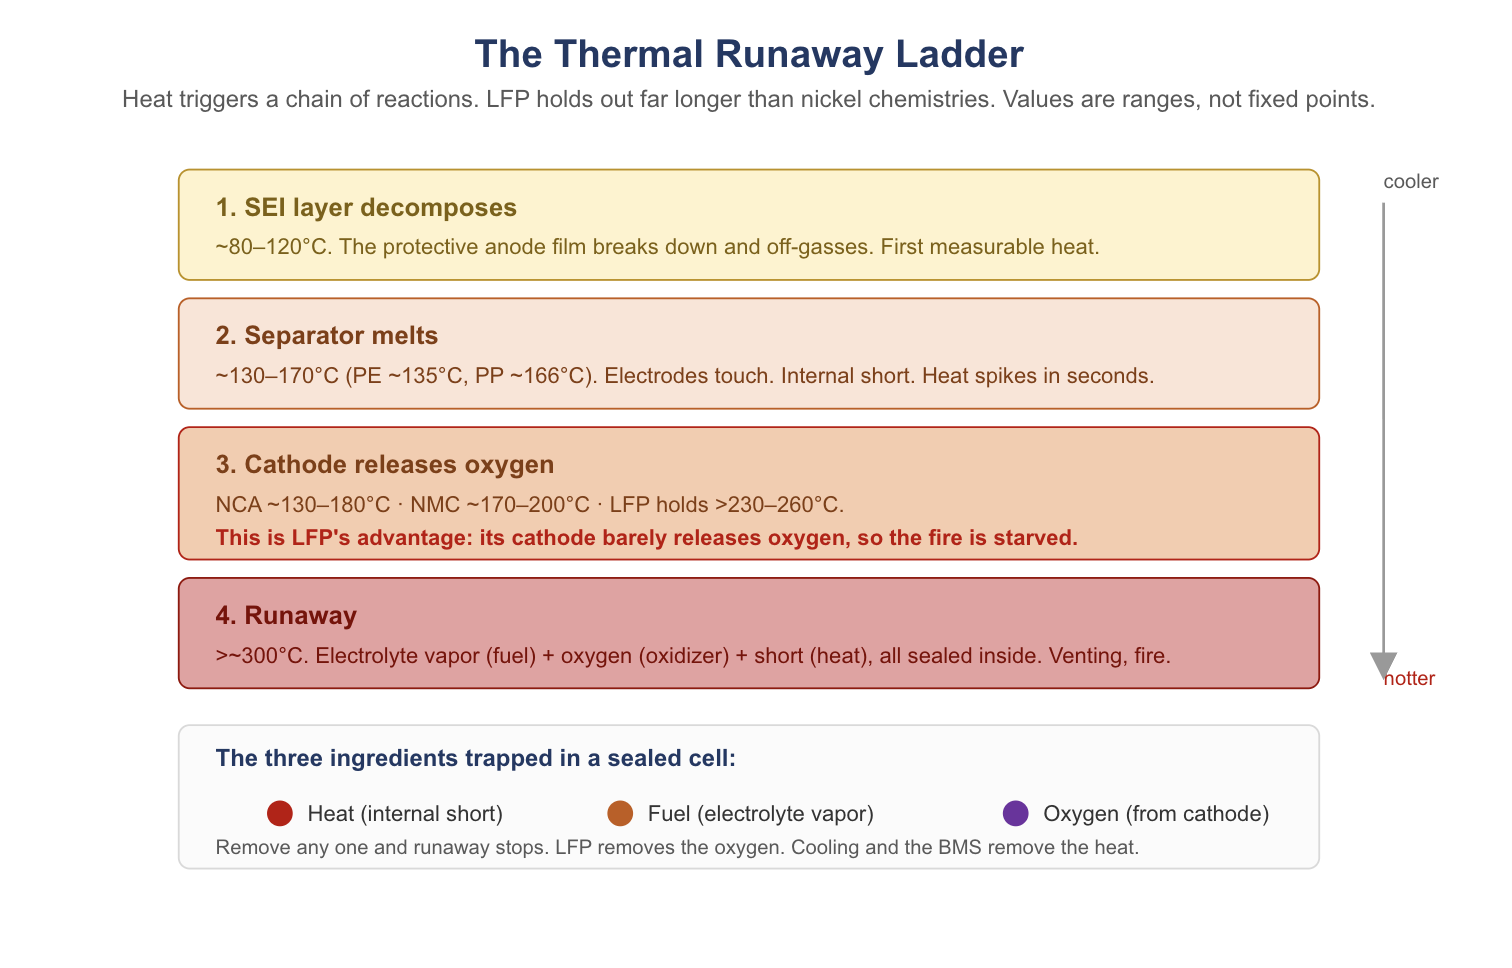
The SEI film starts decomposing around 80 to 120°C (MANLY Battery). The separator melts around 130 to 170°C (polyethylene near 135°C, polypropylene near 166°C), letting the electrodes touch and short (J. Power Sources; Battery Energy Storage System). Then the cathode begins releasing oxygen, and this is where chemistry decides your fate. Nickel chemistries release oxygen early — NCA from roughly 130 to 180°C and NMC from about 170 to 200°C — while LFP holds out past 230 to 260°C and releases far less (J. Power Sources; Battery Energy Storage System). Above roughly 300°C you have fuel from vaporized electrolyte, an oxidizer from the cathode, and heat from the short, all sealed inside one box, and the cell vents and burns (Scientific Reports). Remove any one of the three conditions and it stops. LFP’s advantage is that it largely removes the oxygen. The thermal management system’s job is to remove that heat from the cell.
The flat OCV vs SOC curve, and why it’s a false indicator
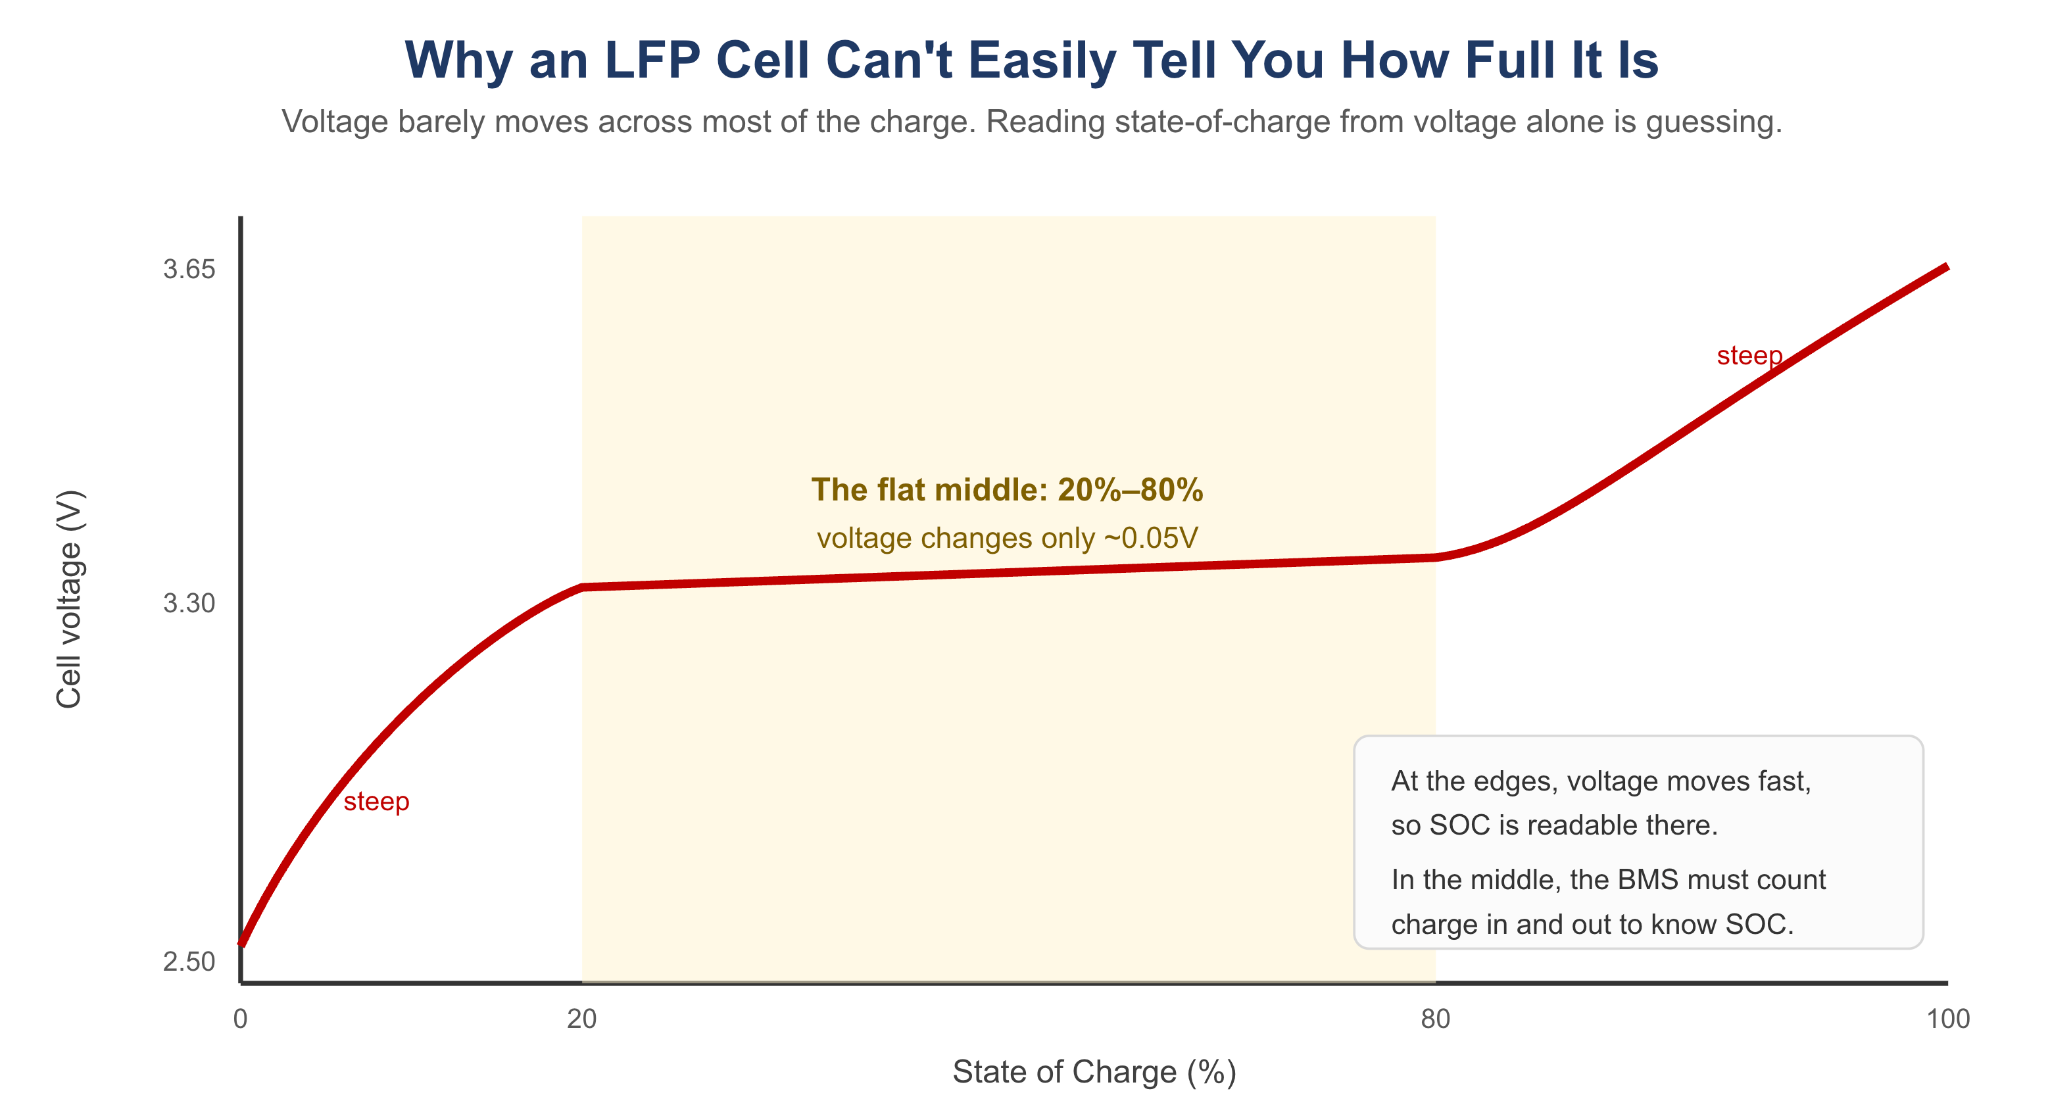
This characteristic of LFP cells is the most important thing for anyone operating LFP-based storage systems. In most batteries, voltage falls steadily as the cell empties, so you can read the state of charge straight off the voltage. LFP cells do not do that. Because of the way its cathode works — converting between two distinct phases rather than blending smoothly — the voltage stays almost flat, around 3.3V, across roughly the middle 20% to 80% of the charge. Across that whole band it moves only a few hundredths of a volt. That flatness is wonderful for delivering steady power and terrible for knowing how full the cell is. Voltage alone cannot tell you whether an LFP cell is 40% or 70% charged. This is why a good LFP battery management system does not rely on voltage in the middle. It counts every unit of charge going in and out, a method called coulomb counting, and corrects that count against voltage only at the steep ends, where voltage is actually informative. Get this wrong and the pack either strands usable energy or overstates how much is left, and both cost money in a stationary asset. This issue is also highly visible to customers, and it makes up a significant portion of escalations.
How to design the BMS and the BTMS
The BMS is the cell’s nervous system, and against the failure modes above it needs to do five things well.
Monitor every cell, not just the pack. The most dangerous over-discharge happens to one weak cell inside a series string while the pack terminal voltage still looks fine. Per-cell voltage monitoring is what catches it. Without it, a weak cell can be driven below its damage threshold repeatedly before anything trips. Use the maximum voltage, minimum cell voltage, and voltage spread to develop the decision matrix.
Enforce hard voltage limits with margin. Over-voltage protection stops the plating and electrolyte breakdown that result from overcharge. Under-voltage protection stops the copper dissolution that comes with deep discharge. For LFP, that means holding the cell inside roughly 2.5V to 3.7V, and disconnecting well before the edges rather than at them (NEWARE).
Lock out damaged cells. If a cell has spent too long below its floor, the safe response is to permanently disable it, because recharging it risks the copper-dendrite short described above. A BMS that lets a user force-revive a deeply discharged cell is a liability. However, per-cell lockout hardware is expensive; in practice, the whole pack is locked out instead.
Estimate state of charge by counting, not just reading voltage. Because of LFP’s flat curve, the BMS must integrate current over time and correct against voltage only at the ends. Use sophisticated algorithms, including coulomb counting and Kalman filtering, to accurately estimate the state-of-charge and state-of-health of the pack. Calibration of cells needs to be triggered regularly to get a good understanding of the two metrics. Good state-of-charge and state-of-health estimation is a customer-facing metric, and any discrepancy leads to erosion of trust.
Balance the cells. Cells drift apart over life, and the weakest one sets the limit for the whole pack. Cell balancing keeps them aligned so no single cell is repeatedly pushed to its edge, which is both a longevity and a safety function.
The last line of defence: a commanded pyro disconnect
Everything above tries to keep a cell inside its safe window. However, things can go wrong due to multiple factors, especially those outside our control, such as flooding or forest fires. In those emergencies you need to disconnect the pack in milliseconds.
A pyrotechnic disconnect, often called a pyro fuse or pyroswitch, is an irreversible, explosively actuated switch sitting on the high-voltage bus (HIITIO). It is single-use by design. There is no reset and no replaceable element; once it fires, that conductor is permanently cut (RepairsAdvisor). It is used as an active safety device, triggered in case of isolation loss or a massive surge in current. When the BMS detects something no soft protection can safely ride out — an isolation loss, where the high-voltage system is no longer safely separated from chassis ground, or a cell so damaged it has been bricked — it can fire the pyro and take the pack off the bus deterministically, rather than hoping a contactor opens under fault current (HIITIO; RepairsAdvisor). Good designs also give the pyro a self-triggering path that fires on catastrophic overcurrent even if the BMS is gone, so the protection does not depend on software being alive (Eaton; RepairsAdvisor).
One design point follows from this, and it is where I have seen teams get it wrong.
Design the BMS to keep breathing after the pyro fires. The moment most worth understanding is not the disconnect — it is the second after it. If the pyro opens because of a real event, that is exactly when you most want to know what happened. So the BMS should be architected to stay powered, if necessary from a single healthy cell or a small dedicated reserve, long enough to capture the failure state, write it to non-volatile memory, and push it out over telemetry. A pack that goes dark at the instant of the event tells you nothing, and in a fleet that is the difference between fixing a root cause across every unit and guessing.
How the thermal system should be designed
If the BMS manages voltage and current, the thermal system manages the one variable that drives every failure mode: heat.
Hold the cells in their band. Every degradation mechanism speeds up with temperature, and in Indian ambient conditions that is not a small factor. Active cooling that keeps cells within their design temperature window is a first-order safety system. Passive cooling alone is often not enough at 45°C, and liquid-cooled systems become necessary.
Design for propagation, not just prevention. You cannot assume no cell will ever fail. The important design question is whether one failed cell stayed one failed cell. Battery design should take into account cell spacing, thermal barriers between cells, and enclosure design so that a single runaway does not cascade to its neighbours. This is exactly what a UL 9540A-style propagation test checks, and it is the difference between an incident and a catastrophe (J. Power Sources).
Choose materials with the thermal path in mind. Even choices as basic as busbar material change how a fault behaves. Research shows high-conductivity copper busbars can delay the start of runaway but then spread it faster once it begins, so the thermal design has to consider not just steady-state cooling but how heat moves during a fault (J. Power Sources).
Give the BMS eyes on temperature. Thermal sensing feeds the BMS, which can throttle charge rate, limit current, or disconnect before a hotspot becomes a short. The BMS and the thermal system are not two separate systems; they are one safety loop.
The takeaway
Chemistry sets the extreme bounds for a battery, and engineering operates within them safely. LFP wins stationary storage because of its stable phase chemistry, which gives it a long life and, more importantly, a cathode that resists releasing the oxygen that feeds a fire. But that safety margin is a starting point, not a guarantee. It only becomes a safe product when the BMS watches every cell and refuses to let one be over-charged or deeply drained, and when the thermal system holds the whole pack in its temperature band and is built so that one bad cell stays one bad cell.
Start from the cell, understand exactly how it fails, and design each system to catch a specific failure. That is the difference between a battery that lasts fifteen years and one that becomes a headline.
Sources
Peer-reviewed and technical
- Advanced Materials Technologies (Wiley), operando synchrotron study of copper dissolution and deposition on deep discharge; Cu dissolution detectable at 0.5V in an NCA cell — https://advanced.onlinelibrary.wiley.com/doi/full/10.1002/admt.202301246
- Nano Research / SciOpen, review of over-discharge mechanisms: SEI breakdown, copper dissolution, dendrite short circuits — https://www.sciopen.com/article/10.26599/NR.2025.94908060
- ScienceDirect, thermal runaway propagation in a large-scale module; separator melt 130–160°C; LCO/NCA/NMC/LFP onset temperatures; busbar material effects — https://www.sciencedirect.com/science/article/abs/pii/S221313882500308X
- Scientific Reports (Nature), quantitative thermal runaway heat contributions by reaction stage — https://www.nature.com/articles/s41598-025-07824-7
- MDPI Batteries, review of thermal runaway mechanisms; LFP higher decomposition onset from strong P–O bonds — https://www.mdpi.com/2313-0105/12/3/88
- USPTO patent 10,193,354, near-zero-volt storage-tolerant cells; copper current collector dissolution at low SOC — https://image-ppubs.uspto.gov/dirsearch-public/print/downloadPdf/10193354
Technical reference and industry
- Eneronix, BMS protection explained; per-cell UVP, copper dissolution onset below 2.3V, 2.5V pack disconnect, LFP no oxygen release from overvoltage — https://eneronix.com/bms-protection-explained/
- NEWARE, charge and discharge cutoff voltages; LFP window 2.5–3.65V; over-discharge and copper dissolution — https://www.neware.net/news/how-to-determine-the-charge-and-discharge-cutoff-voltages-for-lithium-ion-batter/230/139.html
- MANLY Battery, thermal runaway temperature ladder: SEI 90–120°C, separator 130–180°C, cathode oxygen release by chemistry — https://manlybattery.com/battery-thermal-runaway-temp-stages-controls/
- Battery Energy Storage System, LFP thermal decomposition stages; separator PE ~130°C / PP ~170°C; LFP runaway typically above 250°C — https://www.battery-energy-storage-system.com/news/why-lifepo4-battery-thermal-runway.html
- Envodrive, thermal runaway causes; over-discharge below ~2.5V and copper dissolution — https://envodrive.com/en-us/blogs/articles/thermal-runaway-in-lithium-ion-batteries-causes-risks-and-prevention
Section 1 commercial and techno-economic data (see the cell-chemistry field guide for the full source set)
- PatSnap, long-duration storage landscape: iron-air, vanadium flow, costs, cycle life — https://www.patsnap.com/resources/blog/articles/energy-storage-2026-iron-air-vanadium-flow-caes/
- Electrek, CATL Tener Sodium grid product, cycle claims — https://electrek.co/2026/07/16/catl-sodium-ion-15000-cycle-grid-storage/
- LiFePO4-battery.com, Hithium sodium-ion cycle retention data — https://www.lifepo4-battery.com/News/hithium-sodium-ion-battery-launch.html
- ESS Tech Inc., Form 8-K risk factors, June 2026, iron flow deployment risk — https://www.sec.gov/Archives/edgar/data/0001819438/000181943826000053/updatedriskfactors2026sodi.htm
- IDTechEx, solid-state commercialization status — https://www.idtechex.com/en/research-article/solid-state-battery-commercialization-mass-production-taking-off/32942
Commercial leaders and market share
- TYCORUN, top 10 power battery cell manufacturers 2026: CATL 40.1% and BYD 14.2% global share; LFP/NMC/sodium breadth; solid-state pilot targeting 500 Wh/kg for 2027 — https://www.tycorun.com/blogs/news/top-10-power-battery-cell-manufacturers
- evlithium, 2026 battery technology trends: fifth-gen LFP mass production (CATL, BYD, Gotion), BYD solid-state batch demo ~2027, sodium-ion status — https://www.evlithium.com/lifepo4-battery-news/2026-battery-technology-trends-lfp-solid-state-sod.html
- Energy Solutions, sodium-ion commercial producers: CATL, HiNa, Northvolt, Faradion (Reliance, India), Natron, BYD — https://energy-solutions.co/articles/sub/sodium-ion-batteries-cheaper-lithium-alternative
- SodiumBatteryHub, leading sodium-ion manufacturers 2026 — https://sodiumbatteryhub.com/2026/06/03/top-10-global-sodium-ion-battery-manufacturers-in-2026/
- Blackridge Research, flow battery companies: Invinity, Rongke, CellCube, Sumitomo — https://www.blackridgeresearch.com/blog/top-flow-battery-companies-manufacturers
- Exoswan, long-duration storage: Eos zinc, Form Energy, Invinity — https://exoswan.com/energy-storage-stocks/
Cost data
- BloombergNEF 2025 Lithium-Ion Battery Price Survey: pack $108/kWh avg, LFP pack $81/kWh, NMC pack $128/kWh, stationary packs $70/kWh, cells as low as $36–50/kWh — https://about.bnef.com/insights/clean-transport/new-record-lows-for-battery-prices/
- UDPOWER, 2026 price-per-kWh guide citing BNEF LFP $81 vs NMC $128/kWh — https://udpwr.com/blogs/portable-power-station-knowledge/lithium-battery-cost
- Zvepow, sodium-ion cell $50–56/kWh and system $80–120/kWh in 2026; NMC 811 $64–65/kWh — https://www.zvepow.com/new/sodium-Ion-battery-cost-per-kwh-in-2026
- HowToStoreElectricity, VRFB capex ~$450–750/kWh, electrolyte 40–60% of cost — https://howtostoreelectricity.com/vanadium-redox-flow-battery-cost-per-kwh/
- Zion Technology, vanadium ~$800–1,200/kWh installed; ESS Tech going-concern disclosure Q1 2026 — https://ziontechnologies.co.nz/vanadium-vs-iron-vs-zinc-bromine-which-flow-battery-chemistry-wins-in-2026/
- Energy Solutions, Form Energy iron-air <$20/kWh target, 40–50% efficiency — https://energy-solutions.co/articles/sub/aqueous-iron-air-batteries-long-duration-storage
- Sarah Constantin (Substack), zinc-air ~$60/kWh and iron-air $20/kWh as projections, with materials-cost context — https://sarahconstantin.substack.com/p/zinc-air-and-iron-air-batteries
Pyrotechnic disconnect
- HIITIO, application of pyro fuses in EVs: BMS-triggered, ~2 ms severance, piston mechanism — https://www.hiitio.com/application-of-pyrofuse-in-new-energy-vehicles/
- PatSnap Eureka, pyro-fuse fault isolation: sub-5 ms, TRL 9, de facto HV isolation standard — https://eureka.patsnap.com/blog/research-reports/pyro-fuse-protection-evs-fault-isolation-reliability-service-risk/
- HIITIO, what is a pyrofuse: high-voltage disconnect used by Tesla and other EV makers — https://www.hiitio.com/what-is-pyrofuse/
- Eaton Bussmann EV pyro fuse: dual-trigger, BMS plus self-triggering, 400/800V, permanent disconnect — https://www.eaton.com/us/en-us/catalog/emobility/eaton-ev-pyro-fuse.html
- RepairsAdvisor, pyro-fuse systems: BMS commands activation on thermal/overcurrent fault; single-use; self-triggering option — https://repairsadvisor.com/blog/how-pyro-fuse-systems-work/
Figures as reported through mid-2026. Where sources disagree, ranges are shown. “No verified figure found” means I could not locate a credible published number, not that the figure does not exist.